- Pål Kristian Granholt and Marcus Nilsson

Introduction
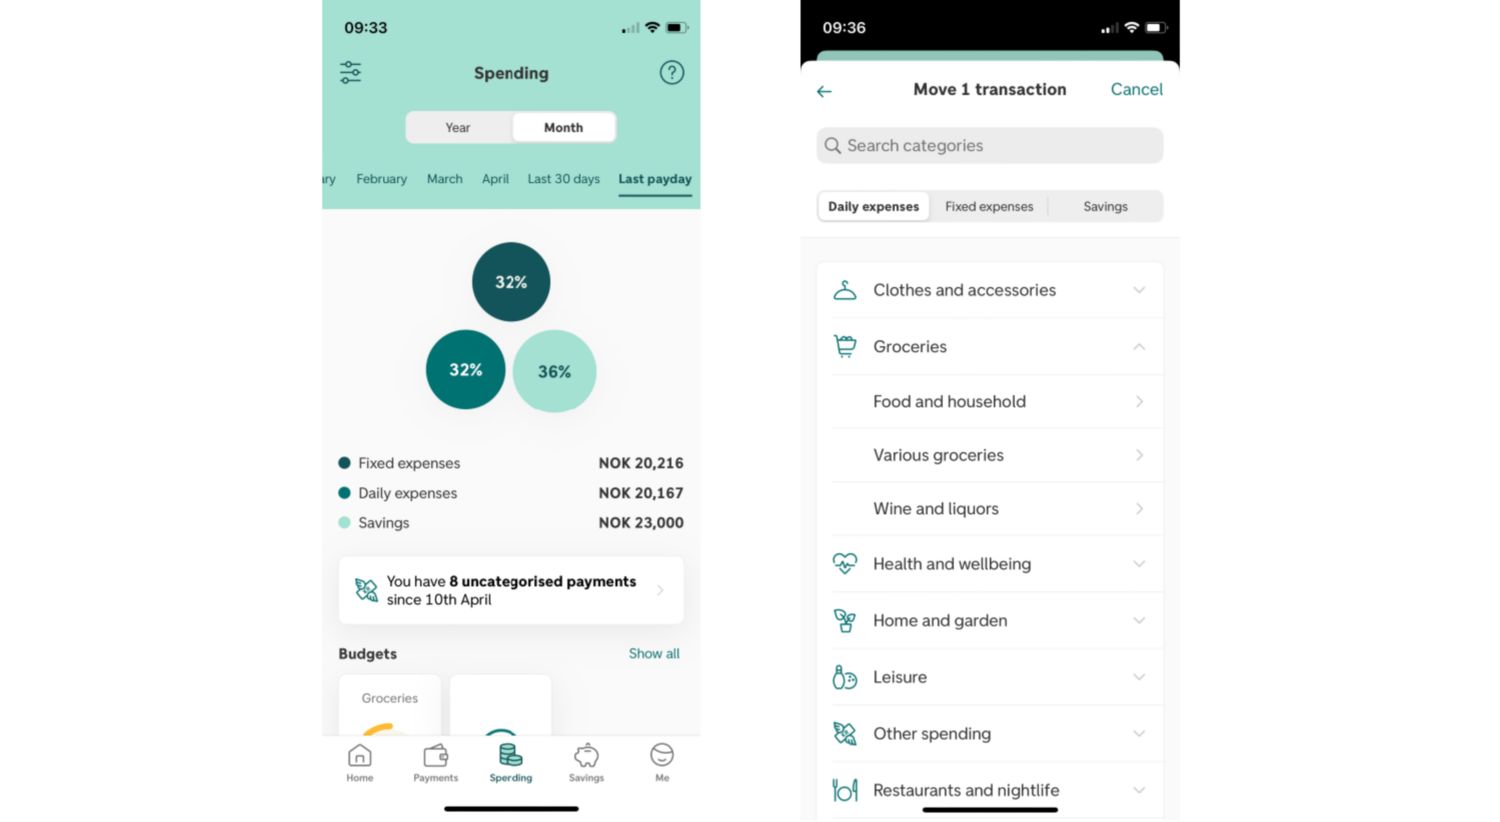
The Personal Finance Management (PFM) team is helping DNB’s customers manage their finances. One of the features designed to assist with this, is Spending:

Here the users can get informed on what they spend their money on and set up budgets. A central feature in Spending is the categorisation of transactions. If you use your DNB card to pay at a grocery store, you will later see that the purchase has been categorised for you, as “Food and household”. Your Ruter trips are categorised as “Public transport” and your new laptop has been categorised as “Tools and electronics”.
The categories are organised in a hierarchy with 19 main categories covering 83 subcategories. By organising the categories into a hierarchy, we can accommodate different customer needs. Some customers are more interested in the detailed categories, while some would like it on a higher level. It also allows for drilling down when one wants to see what has been added up. In the right picture above, we can see an example of main category “Groceries” which has three subcategories below it:
- “Food and household”
- “Wine and liquors”
- “Various groceries”
The categorisation enables DNB to provide more and better services to its customers. We can assist you setting up a budget in the app, and then track that spending without you having to manually label every purchase you make. We can help you become more aware of exactly how much you spent on food and drinks in December, or how much money you will have left for Christmas. We believe it is our responsibility as your bank to help you have control over your finances. And understanding of your spending is an important first step for that to happen.
How categorisations are made
The way we categorise today is by a rule-based engine that ingests data about each transaction. If you pay with your DNB card, we get data about how much you spent, when it happened, and with which card you paid. But there is also additional data that relates to the store where you made your purchase and details about the specific payment terminal. It is the latter data that is used to categorise each transaction.
Unfortunately, for the categorisation-feature, the current model relies heavily on the data we receive from the stores. This data is increasingly becoming sparser, as payment services like Google / Apple / Samsung Pay, Vipps and Klarna do not necessarily share the same data as the store where you made your purchase. In addition, there is some manual maintenance of the rules in the rule-engine. To solve those issues, we needed something more flexible. Something that could handle increasingly complex and/or sparse data, and still categorise the transactions. Our text model was created specifically for this purpose.
The text model
The text model is a deep neural network. Just like the rule-based engine, it relies on data about a transaction to categorise it. But unlike the rule-based engine, it is flexible enough to handle just about any data from the transaction. This means that even with a lot of missing data, it can still make predictions.
We call it the text model because it is designed to ‘read’ texts. For instance, if you send someone money on Vipps and add a note saying, “dinner at burger king”, our model can read that and deduce that this is money for a restaurant bill, and not just that it is a peer-to-peer payment.
How the model works
The model is based on TensorFlow, a popular framework for neural nets. Specifically, we use what is known as a Long Short-Term Memory model (LSTM). It is a type of Recurrent Neural Network (RNN) architecture that is designed to handle the problem of long-term dependencies in sequential data. Unlike traditional RNNs, which tend to forget information over time, LSTMs have a memory mechanism that allows them to retain information for an extended period, making them well-suited for tasks that involve modelling sequences of data. LSTM models work by using the weights in the neural network to store important information and a system of gates that control what information is important and when. This helps LSTMs handle different lengths of information and remember both long and short-term details.
The model learns to identify patterns in the text by adjusting the weights of its internal connections based on the error between its predictions and the actual values in the training data. Over time, the LSTM network becomes better at recognising patterns and making predictions, allowing it to understand the meaning of a text in a general sense. However, the precise meaning of a text is often context-specific and can be difficult for an LSTM network to fully capture.
How good is the model
To measure how well the model works for our purpose, one of the metrics we use is accuracy. Accuracy is calculated by dividing the number of correct predictions divided by all predictions. E.g., if 50 out of 100 predictions were correct, the accuracy would be 50%.
When we test the model, we measure the accuracy on the two lowest levels of our categorisation hierarchy: main category and subcategory. The reason for that is some of the subcategories can be remarkably similar if located within the same main category. One example could be the subcategories “Personal care” and “Pharmacy and wellness”. Both are in the main category “Health and wellbeing”. For some people it’s not that important that the most detailed level is correct if the main category is. As we only have 19 main categories, these will be easier for the model to predict, and the results might be more representative for most customers and when comparing against other PFM solutions.
The results were very convincing with an accuracy of 90.4% for subcategory prediction and 93.5% for the main category prediction.
How the model shows its output
After the model is trained and tested, it is ready to be used. The model is given data about a transaction and uses what it has learned to predict the probability of the text belonging to each category. All categories will get a probability, where the most likely category will be assigned the highest probability.
If there were only three available categories, it might look something like this for the text “Dinner at Burger King”:
- Restaurant, café, bar = 99.1% probability
- Various restaurant and nightlife = 0.5% probability
- Hotel and accommodation = 0.4% probability
You’ll notice that all predictions add up to 100%. This means that if the model is certain about one category, it devalues the predictions in other categories. When the model is very sure of the prediction, one category has close to 100% and most of the other categories are very close to 0%.
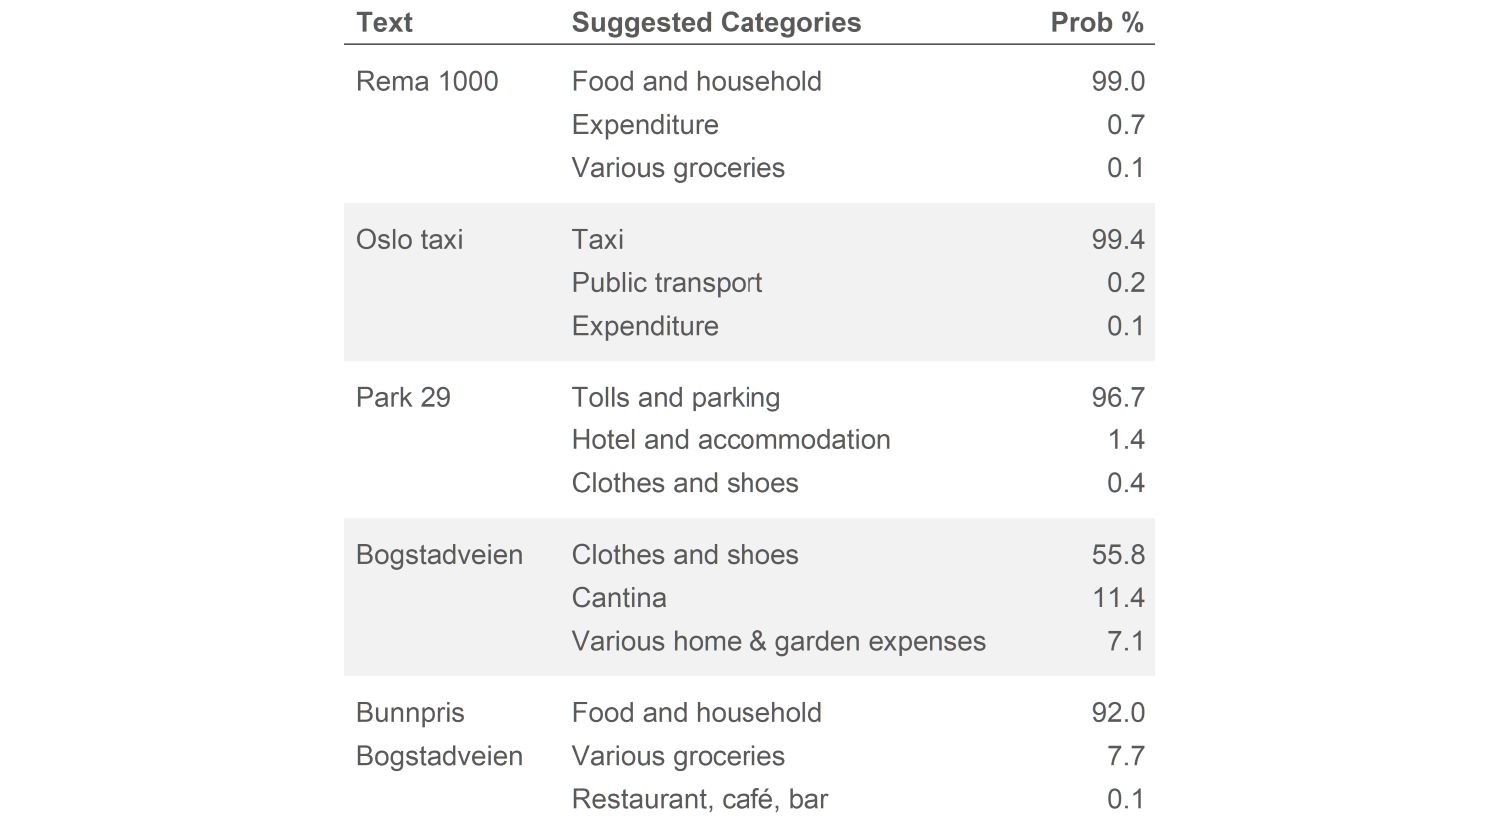
Let’s look at some examples, and see how the model works, and what might confuse it. Please note that we only show the top three suggestions here, not all 83. This is also why the three suggestions shown don’t add up to 100%.

Both “Rema 1000” and “Oslo taxi” are easy – these are plentiful in the training data, and their categorisation is commonly understood. However, note that depending on how you categorise your spending, the 2nd or 3rd suggestions might also be what you want. For a person who wants to have all reimbursable expenditures in the “expenditure” category, a taxi trip for work might for them correctly be categorised as “expenditure”.
This exemplifies one of the trickier parts of categorisation; even among us humans, we might disagree on what is the correct category. Some other examples:
- Golfing – is it exercise or leisure?
- Crypto – is it investment, gambling, or something else?
- Gas station – is it food, gas, or both?
- Restaurant in a hotel – is it “hotel” or “restaurant”?
Moving on to “Park 29”, a restaurant in Parkveien 29 in Oslo. As part of our data pre-processing, we remove numbers and non-letter characters. Which means that the only part that is left for the model to analyse is “park”, a common term used about parking lots. And lo and behold, our model is confident that this is parking.
Bogstadveien is a popular shopping street with lots of shops. When only the street name is included, we see that our model does have some suggestions. Clothes, cantina and various home and garden sound right about what kinds of stores there are in Bogstadveien. Once we add the name of a store, “Bunnpris Bogstadveien”, we instantly see a shift to “Food and household”. This shows how more information usually gives better predictions. If only a little data is available, we can still make a prediction, albeit a less accurate one.
How the model will be used
As part of the Spending functionality in the mobile bank, the customer can change (recategorise) the category chosen by the rule-engine.The first implementation of the text model supports the customer in that task, in a feature called recategorisation suggestions. Previously, if a customer wanted to recategorise a transaction, they’ve had to choose among all possible subcategories. The text model will give our users three recommended categories to choose from, to make the process quicker and easier:

In the future we would like to implement the text model for those transactions where the rule-based engine is uncertain of the category. Additionally, we’re looking to implement the model for PSD2-transactions. These are transactions handled by other banks but displayed in our mobile bank. As we have less data for these transactions, the default rule engine may not perform optimally.